Know what your electricity data means, and test its limits.
DemandProof checks electricity demand baselines and demand-response results. The prototype compares three baseline methods side by side, puts an uncertainty band on its own estimate, records every input, and refuses to give a number when the data cannot support one. Independent of who gets paid on the figure.
Status: Experimental prototype. Results are indicative. The uncertainty band is not yet calibrated.
01 The problem
You can meter what happened. You can't meter what didn't.
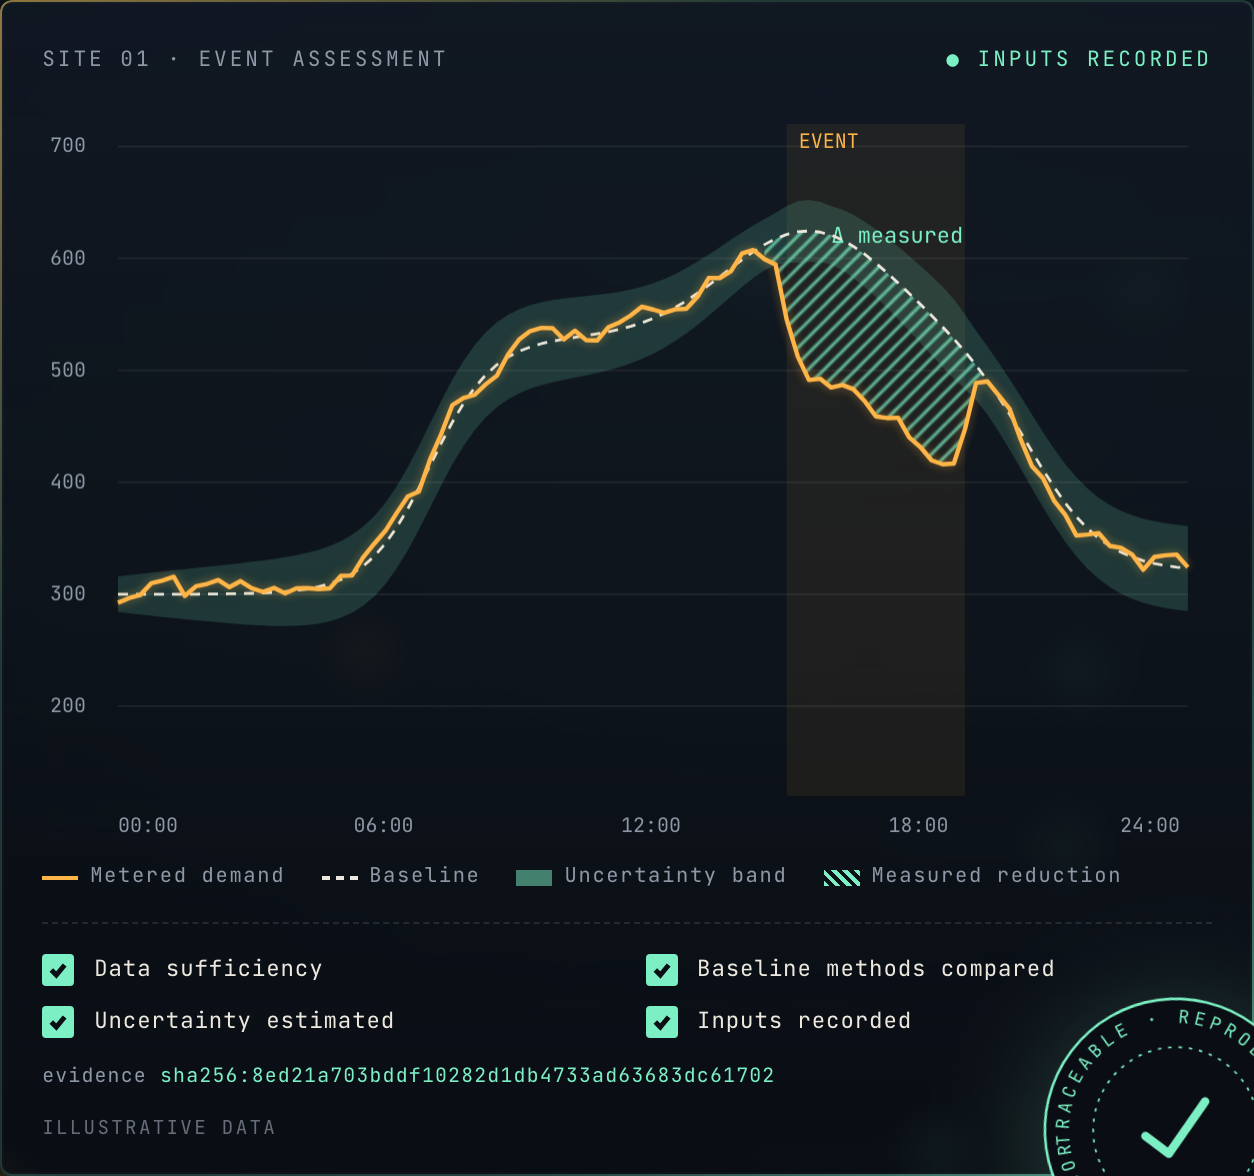
Every demand-response result depends on an estimate of the electricity a site would have used, which never actually happened. DemandProof tests the data and the uncertainty behind that estimate before anyone pays or gets paid on it.
- When a site cuts its use, how much would it otherwise have used?
- When a baseline is calculated, how do you know it is right?
- When flexibility is sold, how much confidence can you put in the result?
02 Inside an assessment
A result you can check. A refusal when the data falls short.
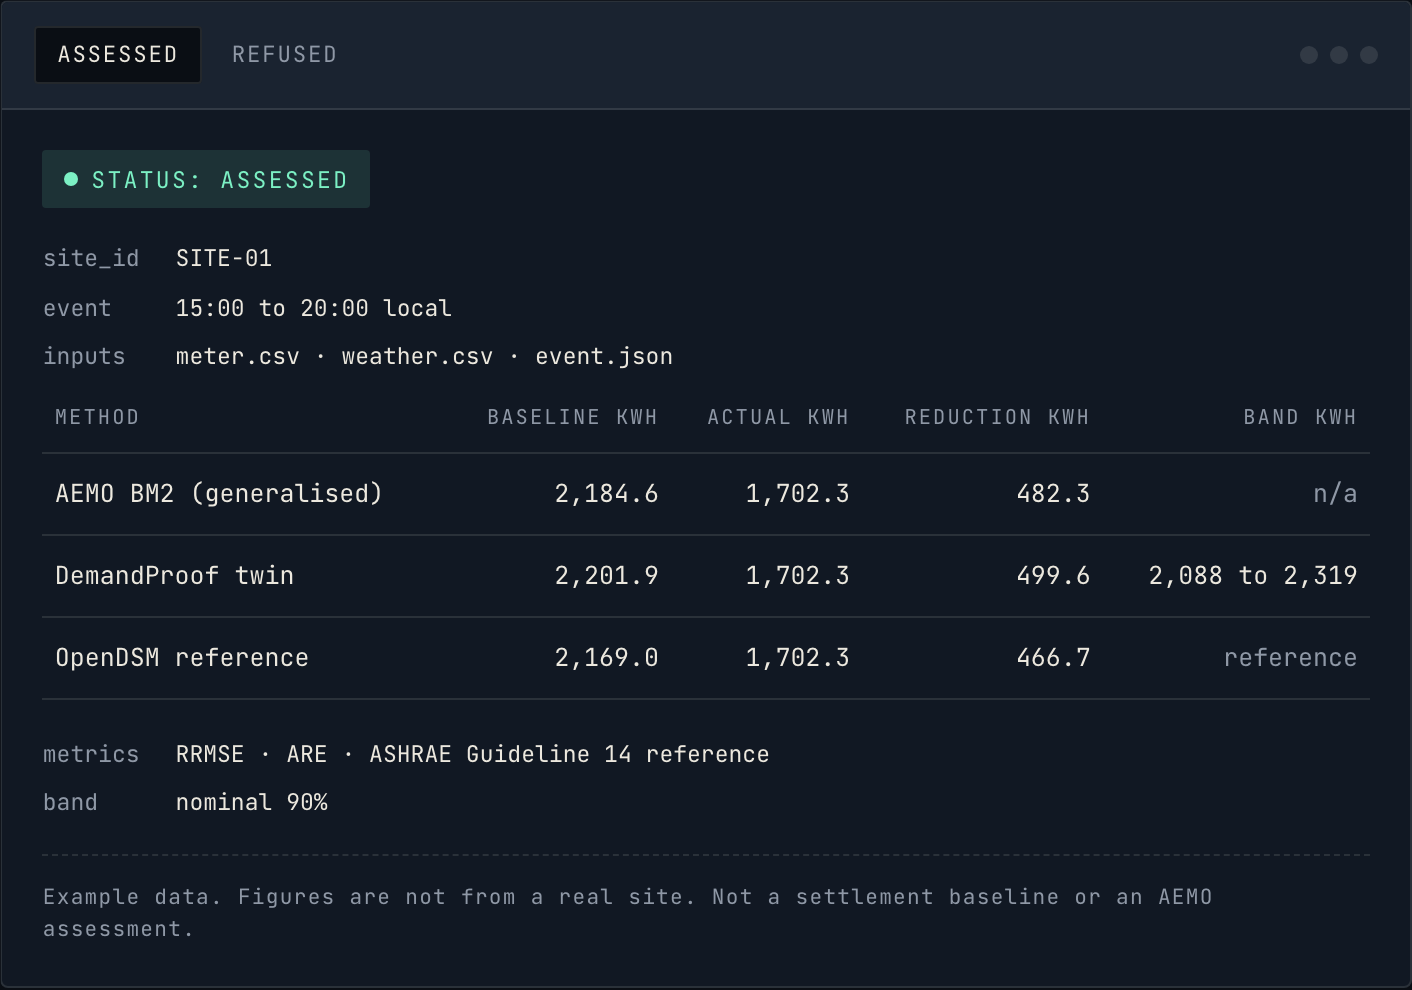
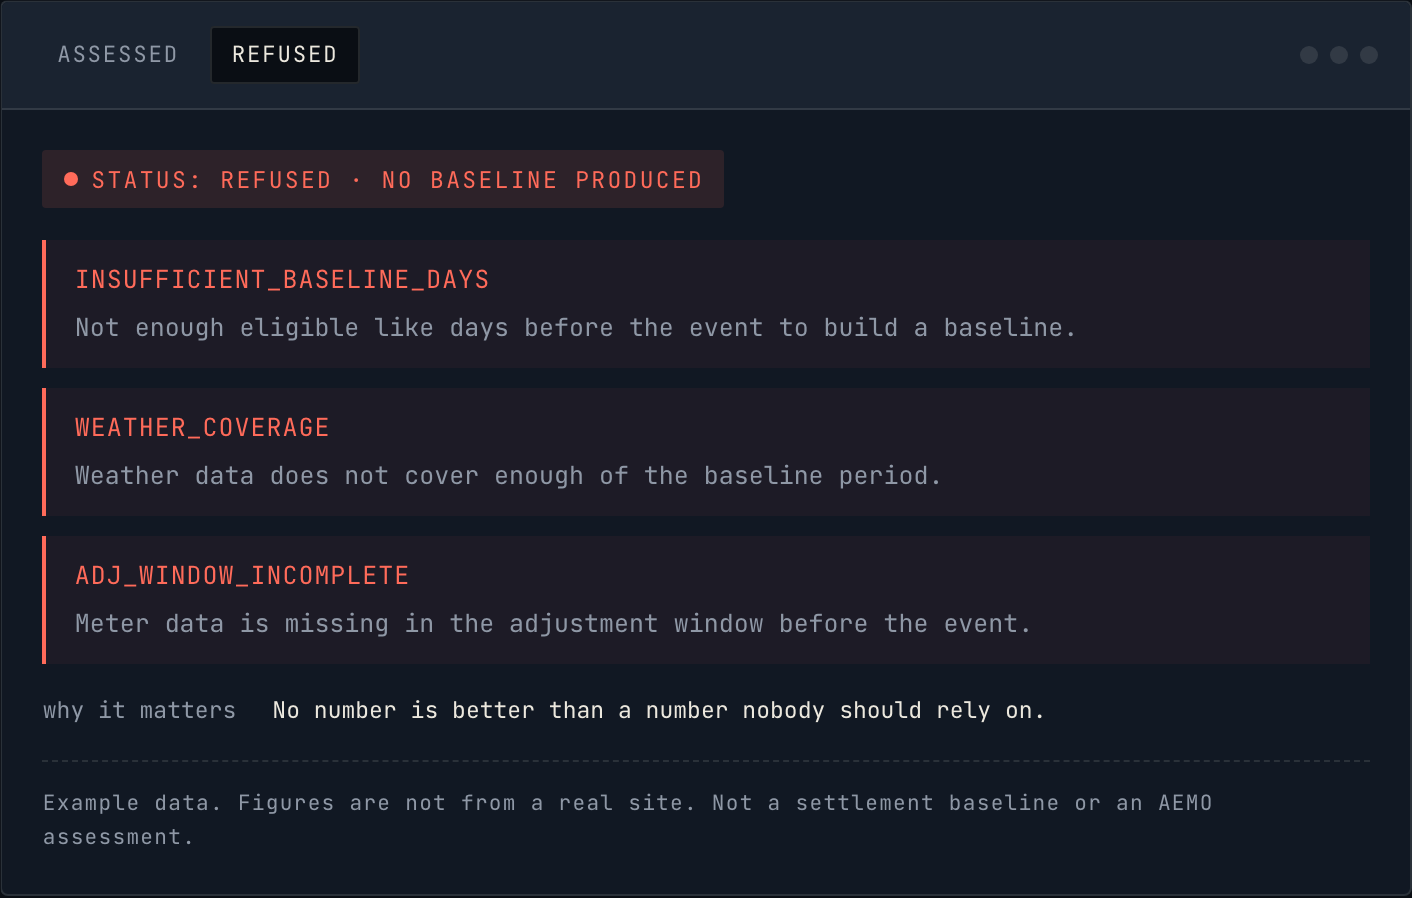
In the prototype, an assessment compares three baseline methods side by side, puts an uncertainty band on DemandProof's own estimate, and records exactly which inputs produced it. When the data cannot support a result, DemandProof says so with a coded reason, instead of a number that only looks reliable.
03 What DemandProof does
Six steps from meter data to a result you can check.
What the prototype does today.
Baselines from your data
Calculate demand baselines from hourly meter data, weather and business-day calendars.
What the site would have used
Estimate event-window demand with a model trained on the site's own history, next to AEMO's BM2 method and the CalTRACK reference model.
Check the data and the method
Check there is enough data for a result, and report indicative accuracy metrics for each method.
Put a band on it
Put an uncertainty band on the estimate, not yet calibrated, and list the limitations in plain terms.
Evidence you can replay
Record every input file checksum, the code version and the settings, so a result can be traced and run again.
A plain report
A one-page report: the result or the refusal with its coded reasons, the metrics and the limitations.
04 Works with what you have
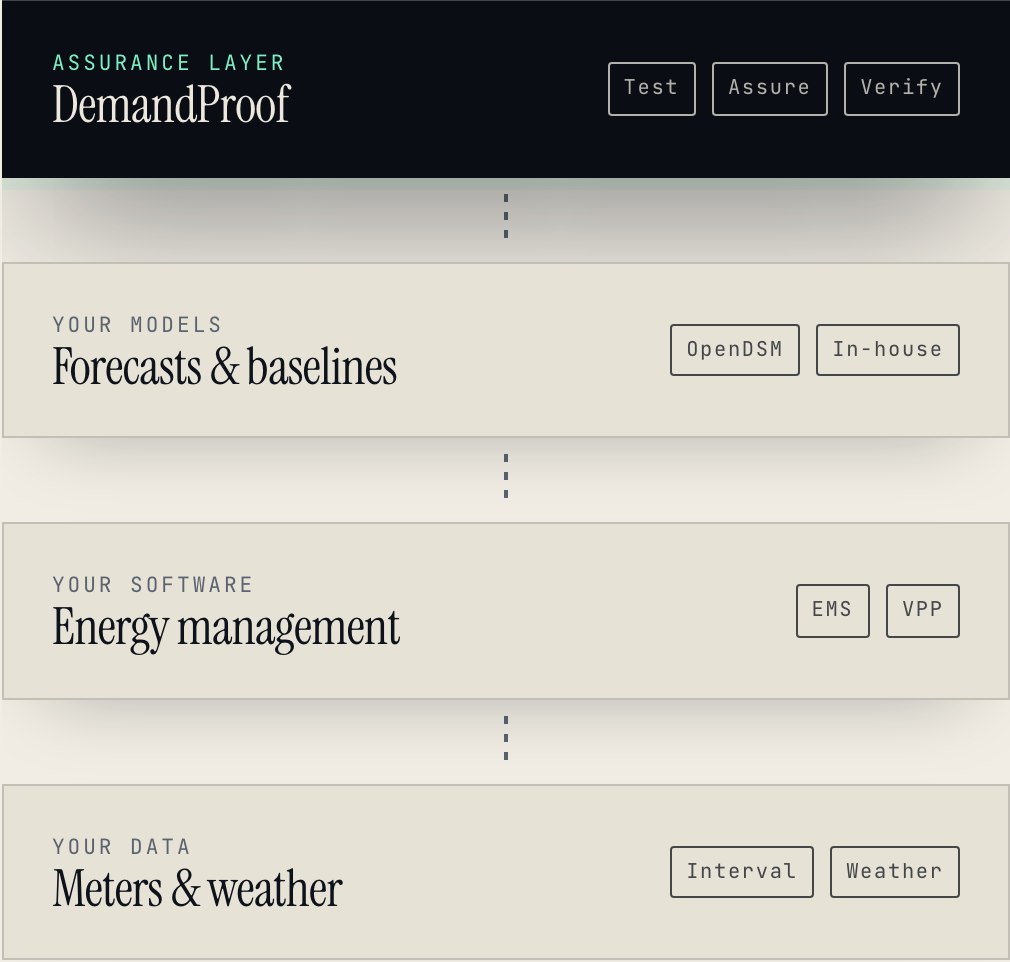
Your systems calculate the result. DemandProof checks the evidence behind it.
You keep your forecasting models, meter systems and energy management software. DemandProof sits alongside them as an independent check. In the prototype:
- Calculates AEMO's published BM2 (business days) baseline alongside its own estimate, for comparison
- Uses OpenDSM's open data-sufficiency checks and CalTRACK hourly model as a reference
- Reports ASHRAE Guideline 14 reference metrics for the CalTRACK model, for international measurement and verification
- Every result traceable to its inputs, model version and method
DemandProof is not affiliated with or endorsed by AEMO.
05 Who it's for
For anyone whose numbers have to survive a question.
- A
Energy retailers and aggregators
See how reliable your baselines are, evaluate flexible demand portfolios and manage measurement risk.
- B
Networks and utilities
Assess demand flexibility programs and strengthen the measurement evidence behind planning and reporting.
- C
Manufacturing, industry and data centres
Understand your demand, find the loads that can move and check what demand response is really worth to you.
- D
Virtual power plant operators and energy software companies
Evaluate distributed flexibility and portfolio performance, or build baseline checks into your own product.
06 Questions
What you need, and what you get.
What data do I need?
Hourly interval meter data for the site, weather for the same period, and the times of the events you want assessed. We confirm what is enough for your site during scoping.
Does it replace my baseline or settlement method?
No. Your existing methods keep calculating the result. DemandProof checks it independently, compares methods and puts a margin on the figure. It is not a settlement baseline.
What happens when the data isn't good enough?
You get a refusal with a coded reason, such as too few like days or missing meter data, instead of a number that only looks reliable.
Does it work outside Australia?
The prototype works from interval meter data and weather, which every market has. It calculates AEMO's BM2 method for Australian markets and reports ASHRAE Guideline 14 reference metrics, the measurement and verification reference widely used in North America. We confirm the data your market needs during scoping.
How far along is DemandProof?
It is an experimental prototype. Its results are indicative: not a settlement baseline and not an AEMO assessment. Its uncertainty band is not yet calibrated. In testing on historical building data from outside Australia, the nominal 90% band held 82.4% of outcomes (DemandProof experiment DP-EXP-001, October 2026), so the pre-registered calibration test did not support the band. It has not yet been tested on real events or Australian sites.
Where is my data kept?
We agree where your data is kept, and who can see it, in writing before anything is connected.
Need to prove what your site would have used?
Working with us starts small and time-boxed: which sites and events, what counts as a pass, how long it runs, and a written report you keep.